78. Appendix 6: Environmental performance
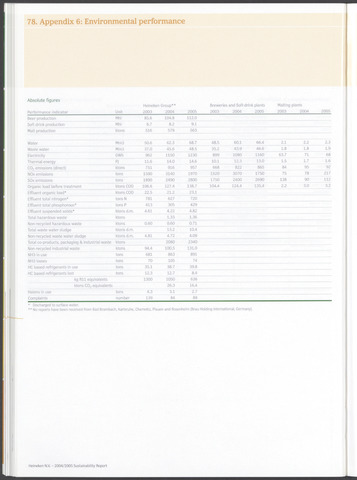
Absolute figures
Heineken Group**
Breweries and Soft-drink plants
Malting plants
Performance indicator
Unit
2003
2004
2005
2003 2004
2005
2003 2004
2005
Beer production
Mhl
85.6
104.8
112.0
Soft drink production
Mhl
6.7
8.2
9.1
Malt production
ktons
516
579
563
Water
Mm3
50.6
62.3
68.7
48.5 60.1
66.4
2.1
2.2
2.3
Waste water
Mm3
37.0
45.6
48.5
35.2 43.9
46.6
1.8
1.8
1.9
Electricity
GWh
962
1150
1230
899 1080
1160
63.7
71
68
Thermal energy
PJ
11.6
14.0
14.6
10.1 12.3
13.0
1.5
1.7
1.6
C02 emissions (direct)
ktons
751
916
957
668 822
865
84
95
92
NOx emissions
tons
1590
3140
1970
1520 3070
1750
75
78
217
SOx emissions
tons
1890
2490
2800
1750 2400
2690
138
90
112
Organic load before treatment
ktons COD
106.6
127.4
138.7
104.4 124.4
135.4
2.2
3.0
3.2
Effluent organic load*
ktons COD
22.5
21.2
23.1
Effluent total nitrogen*
tons N
781
627
720
Effluent total phosphorous*
tons P
413
305
429
Effluent suspended solids*
ktons d.m.
4.61
4.22
4.82
Total hazardous waste
ktons
1.33
1.36
Non-recycled hazardous waste
ktons
0.60
0.60
0.71
Total waste water sludge
ktons d.m.
13.2
10.4
Non-recycled waste water sludge
ktons d.m.
4.81
4.72
4.09
Total co-products, packaging industrial waste
ktons
2080
2340
Non-recycled industrial waste
ktons
94.4
100.5
131.0
NH3 in use
tons
681
863
891
NH3 losses
tons
70
105
74
HC based refrigerants in use
tons
35.1
38.7
39.8
HC based refrigerants lost
tons
12.3
12.7
8.4
kg Rll equivalents
1300
1050
636
ktons C02 equivalents
2673
16.4
Halons in use
tons
4.3
3.1
2.7
Complaints
number
89
Discharged to surface water.
No reports have been received from Bad Brambach, Karlsruhe, Chemnitz, Plauen and Rosenheim (Brau Holding International, Germany).
Heineken N.V. - 2004/2005 Sustainability Report