27.
Reductions in both of these make an important
contribution to slowing down climate change
and combating price increases (for example,
those due to C02 emissions trading).
water consumption - important in reducing
our dependency on water availability and in
neutralising price increases;
discharges of waste - to encourage recycling of
as much of our residual materials as possible in
order to prevent dumping and reduce the cost
of waste discharge;
the Eco Care Indicator - a complementary
parameter that incorporates environmental
management, renewable energy use, air
emissions, waste water pollution prevention
and high value re-use of by-products.
We score our performance against each of these
five parameters on a scale that ranges from
'poor' to 'best in class' and then aggregate the
five results to achieve one final score for our
environmental performance. The indicators are
visualised in the form of a pentagon, which also
shows potential improvements. All scores (except
for the Eco Care Indicator) are monitored on
a quarterly basis and our production units are
required to take action to achieve their targets.
Improvement targets are agreed with each
production unit as part of the three-year planning
process that falls within our World Class
Manufacturing Programme. Internal benchmarking
and the exchange of best practices helps all our
production units to improve their performance.
Climate strategy
Our climate strategy covers two main objectives:
reducing carbon dioxide emissions and reducing
the use and emission of ozone-depleting substances.
Our total carbon dioxide (C02) emissions have
increased slightly from 10.9 kg per hectolitre
in 2004 to 11.2 kg per hectolitre in 2005. This
reported increase results from a change in definition
to include indirect C02 emissions originating from
the import of steam. Without this correction the
emission would have decreased to 10.6 kg C02 per
hectolitre of beer.
Our thermal energy consumption has decreased
from 114 MJ per hectolitre in 2004 to 108 MJ per
hectolitre in 2005, a total which is just above our
target of 107 MJ per hectolitre for 2005. The
corresponding direct C02 emission went down from
7.65 kg C02 per hectolitre in 2004 to 7.15 kg C02
per hectolitre in 2005. The decrease results in part
from the addition of soft drinks to the totals. Savings
have been obtained in St. Petersburg (Russia),
through the improved operation of a combined heat
and power plant, and in's Hertogenbosch, the
Netherlands, due to improved heat recovery in the
new brewhouse.
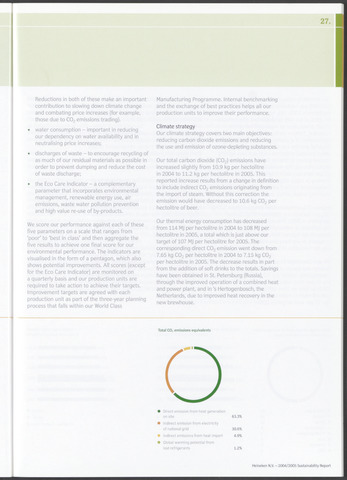
Total C02 emissions equivalents
O
Direct emission from heat generation
on site 63.3%
Indirect emission from electricity
of national grid 30.6%
Indirect emissions from heat import 4.9%
Global warming potential from
lost refrigerants 1.2%
Heineken N.V. - 2004/2005 Sustainability Report