O
SELECTED FINANCIAL
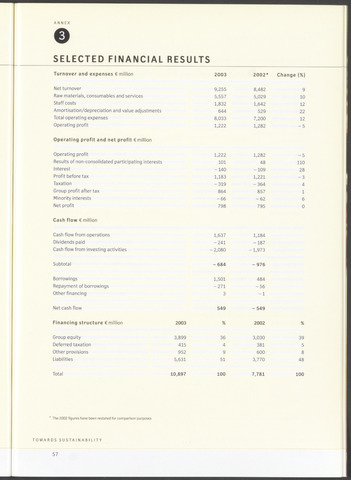
RESULTS
ANNEX
Turnover and expenses million
2003
2002*
Change
Net turnover
9,255
8,482
9
Raw materials, consumables and services
5,557
5,029
10
Staff costs
1,832
1,642
12
Amortisation/depreciation and value adjustments
644
529
22
Total operating expenses
8,033
7,200
12
Operating profit
1,222
1,282
-5
Operating profit and net profit Cmillion
Operating profit
1,222
1,282
-5
Results of non-consolidated participating interests
101
48
110
Interest
-140
-109
28
Profit before tax
1,183
1,221
-3
Taxation
-319
-364
4
Group profit aftertax
864
857
1
Minority interests
-66
-62
6
Net profit
798
795
0
Cash flow million
Cash flow from operations
1,637
1,184
Dividends paid
-241
-187
Cash flow from investing activities
2,080
-1,973
Subtotal
- 684
-976
Borrowings
1,501
484
Repayment of borrowings
-271
-56
Other financing
3
-1
Net cash flow
549
- 549
Financing structure Cmillion
2003
2002
Group equity
3,899
36
3,030
39
Deferred taxation
415
4
381
5
Other provisions
952
9
600
8
Liabilities
5,631
51
3,770
48
Total
10,897
100
7,781
100
The 2002 figures have been restated for comparison purposes
TOWARDS SUSTAINABILITY
57